Cookbook
Complete, working diagrams for common situations. Each recipe is a real file from samples/ — copy it, change the names, and render with kymo. The rendered output is committed alongside each source, so you can see the result before you run anything.
New to the language? Read The .kymo Language first.
Cloud architecture (AWS reference design)
Use when: you're drawing a cloud system with provider regions, nested logical zones, service tiles, external actors, and labelled data flows.
Source: samples/aws_1.kymo → renders to samples/aws_1.svg.

canvas:   1280 x 680

# outer = administrative boundary (AWS region); inner = the company's app domain.
useast1 outer "us-east-1" padding (40, 56) icon aws-logo {
  yourcompany inner "<your-company>.com" padding (24, 24) icon site-globe {
    amplify  aws-tile/aws-amplify/orange       "AWS Amplify"     "Website"                  @ (320, 176)
    lex      aws-tile/aws-lex/orange           "Amazon Lex"      "Natural Language Chatbot" @ (320, 344)
    lambda   aws-tile-hero/aws-lambda/orange   "AWS Lambda"      "Lex Bot Logic Handler"    @ (568, 344)
    connect  aws-tile/aws-connect/orange       "Amazon Connect"  "Contact Center"           @ (448, 512)
  }
  # Inside us-east-1 but outside <your-company>.com
  dynamodb  aws-tile/aws-dynamodb/blue    "Amazon DynamoDB"  "User Account Info"        @ (832, 176)
  bedrock   aws-tile/aws-bedrock/green    "Amazon Bedrock"   "Anthropic Claude 2.1 FM"  @ (832, 344)
  s3        aws-tile/aws-s3/green         "Amazon S3"        "Customer Data"            @ (1064, 344)
  kendra    aws-tile/aws-kendra/orange    "Amazon Kendra"    "FAQ Search"               @ (1024, 520)
}

# Actors and annotations outside AWS
customer  circle/customer-person/blue  "Customer"  ""  @ (72, 344)
internet  circle/internet-cloud/blue   "Internet"  ""  @ (1200, 424)
slack     badge/slack/blue             ""          ""  @ (560, 512)

# Edges
customer --> amplify : "Web"  { src=right(0,-24), dst=left, label_offset=(-40,-8), small }
amplify  --> lambda
lambda   --> dynamodb { src=top, dst=left, dashed }
lambda   --> bedrock  { dashed }
bedrock  --> s3 : "fine-tunable" { label_offset=(0,-10), small }
internet --> kendra : "Web Crawler" { src=bottom, dst=right, via=(1200,520), small }
(Trimmed for the guide — see the file for the full set of edges.)
Techniques on show:
- Nested regions —
innerinsideouter; the outer box auto-grows to wrap everything. - Service tiles —
aws-tile/aws-tile-heroshapes with provider icons (aws-lambda,aws-bedrock, …), pulled from theicons/aws/tree. - Dashed fan-out —
{ dashed }marks the async branches from Lambda. - Anchored edges —
src=/dst=andvia=keep the rails tidy where the auto-router alone would cross lines.
Layered / multi-region system (grid rows)
Use when: you have parallel "lanes" (client / server / cloud) and want same-stage nodes to line up horizontally so cross-lane arrows stay straight.
Source: samples/data.kymo → renders to samples/data.svg.

# 3 regions stacked horizontally; rows align across regions, so cross-region
# same-row edges run straight horizontal.
code_server outer "code-server (IDE)" {
  row jupyter
  row http_client chat_nvidia
}
brev outer "NVIDIA Brev (GPU pod)" {
  row docker
  row nim
  row cache
}
cloud outer "NVIDIA Cloud (SaaS)" {
  row nvcr
  row api_catalog
  row auth
}

# Leaves (positioned by the grid above)
jupyter  cube/notebook/green   "Jupyter Notebook" "Python 3.13"
docker   cube/boxes/green      "Docker Engine"    "daemon"
nim      cube-big/neural/green "NIM Microservice" "llama-3.2-3b · :8000"
# … (see the file for the rest)

# An external actor sitting above the grid, anchored to a node
external user above jupyter gap 32
user circle/user/blue "Agent / User" "Bootcamp participant"

jupyter --> docker : "docker run · SSH" { label_offset=(0,-8) }
docker  ==> nvcr   : "Pull image"       { label_offset=(0,-8) }
Techniques on show:
- Grid
rowmode — each region listsrowlines; equal row indices share a Y, sochat_nvidia --> nim(both on row 1) draws as a straight horizontal arrow. external … above … gap— reserves space above a node for an actor that lives outside the grid.==>— the orange highlight arrow marks the image-pull as an external call.
Process / workflow (BPMN, authored in the DSL)
Use when: you want a BPMN process diagram but would rather write the flow than drag boxes. Declare typed nodes and connect them; kymo lays them out left-to-right (and handles the parallel split/join).
Source: samples/order-flow.kymo → renders to samples/order-flow.svg.

bpmn {
  start S  "Order received"
  task  V  "Validate order"
  xor   GW "In stock?"
  task  P  "Process payment"
  task  N  "Notify customer"
  end!  C  "Order cancelled"
  and   SP "Split"
  task  Pk "Pack items"
  task  Iv "Generate invoice"
  and   Sy "Sync"
  task  Sh "Ship order"
  end   D  "Order delivered"

  S -> V -> GW
  GW -> P : "Yes"
  GW -> N : "No"
  N -> C
  P -> SP
  SP -> Pk ; SP -> Iv
  Pk -> Sy ; Iv -> Sy
  Sy -> Sh -> D
}
Techniques on show:
- No coordinates — the layered auto-layout ranks the nodes and routes the edges for you.
- Parallel gateways —
and SP/and Syform a split/join; the;separator chains two flows on one line. - Decision labels —
GW -> P : "Yes"labels the branch out of the exclusive gateway.
Importing a real .bpmn file
Use when: you already modelled a process in bpmn.io, Camunda Modeler, or Signavio and want to render it as a kymo SVG.
kymo samples/order.bpmn # → samples/order.svgkymo reads the geometry from the file's Diagram-Interchange section and renders it as laid out — no layout pass runs, so the result matches your modeller. Multi-participant collaborations work too:
kymo samples/collaboration.bpmn # → samples/collaboration.svgFor the full element-to-shape mapping (and BPMN export via --bpmn), see the BPMN element mapping (BPMN-MAP-001).
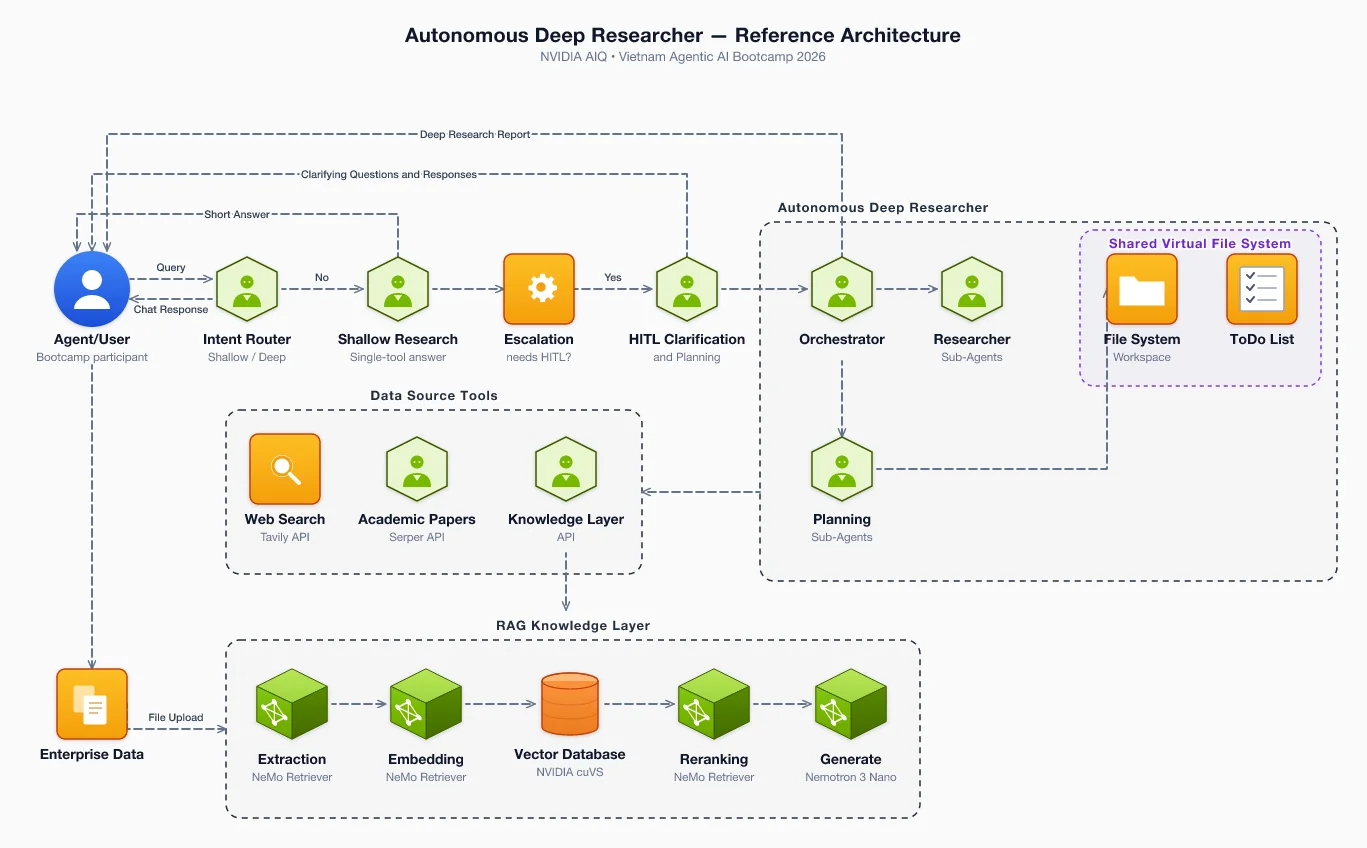
Animating and exporting
Any diagram above can render to other targets — the source doesn't change, only the flag:
kymo samples/aiq.kymo --animate     # → samples/aiq-animated.svg  (flowing-dash edges)
kymo samples/aiq.kymo --figma       # → samples/aiq.figma.js       (paste into Figma plugin console)
kymo samples/aiq.kymo --excalidraw  # → samples/aiq.excalidraw     (open at excalidraw.com)
The animated SVG is pure CSS — open it in a browser to see the edges flow. Here's the NVIDIA AIQ sample as an animated WebP:
See also
- The
.kymoLanguage — every building block explained. samples/— every example file with its rendered output.- FAQ & Troubleshooting — when a diagram doesn't come out right.